Become a Job-Ready Data Analyst with AI in 6 Months
The Data Analytics with Artificial Intelligence course in Andheri by Ntech Global Solutions is designed for students and working professionals who want to build a future-ready career. This industry-oriented program combines data analytics, machine learning, and AI tools with real-world projects, expert mentorship, and strong placement support in Andheri, Mumbai.
⭐⭐⭐⭐⭐
Student's Trained
0Hiring Partners
0Placement Record
0/span>Highest Salary Drawn
0Course Overview
Data Analytics with AI Course in Andheri offered by Ntech Global Solutions is designed for students, working professionals, and business owners who want to build strong skills in data interpretation, visualization, machine learning, and AI-driven decision making. In today’s digital world, every industry — from finance and healthcare to ecommerce and manufacturing — depends on data. This course helps you understand how organizations collect data, analyze trends, make predictions, and automate insights using Artificial Intelligence.
Our comprehensive training covers Excel, SQL, Python programming, Power BI dashboards, statistics for data analysis, machine learning algorithms, predictive analytics, and AI fundamentals. You will learn from industry-experienced trainers who guide you through real-time projects and case studies based on actual business scenarios.
Whether you are a fresher looking to start your career, or a working professional planning to upskill in a high-growth field, this AI-integrated Data Analytics course in Andheri helps you gain job-ready skills. The program includes hands-on tools, capstone projects, mock interviews, and resume preparation to help you become a confident and skilled Data Analyst.
By the end of the course, you will know how to clean, transform, visualize, model, and present data insights using industry-standard tools and AI automation techniques. If you want to become a future-ready data professional, this is the perfect course to start your journey.
Who Should Sign Up?
- IT Engineers
- Data and Analytics Manager
- Business Analysts
- Data Engineers
- Banking and Finance Analysts
- Marketing Managers
- Supply Chain Professionals
- HR Managers
- Math, Science and Commerce Graduates
Program Features

Live Interactive Sessions

Industry Expert Trainer

Comprehensive Curriculum

Hands-on Projects

Doubt-Clearing Sessions

Flexible Batches

80/20 Learning Approach

100% Placement
What You’ll Master
Kickstart your Data Analytics journey with our all-in-one course! Learn Excel, SQL, Power BI, Tableau, Data Visualization, and more—using industry-standard tools and real-world datasets.


Data Analytics with Artificial Intelligence Curriculum
Module 1: DATA ANALYSIS FOUNDATION
- Data Analysis Introduction
- Data Preparation for Analysis
- Common Data Problems
- Various Tools for Data Analysis
- Evolution of the Analytics domain
Module 2: CLASSIFICATION OF ANALYTICS
- Four types of the Analytics
- Descriptive Analytics
- Diagnostics Analytics
- Predictive Analytics
- Prescriptive Analytics
- Human Input in Various type of Analytics
Module 3: CRIP-DM Model
- Introduction to CRIP-DM Model
- Business Understanding
- Data Understanding
- Data Preparation
- Modeling, Evaluation, Deploying, Monitoring
Module 4: UNIVARIATE DATA ANALYSIS
- Summary statistics -Determines the value’s center and spread.
- Measure of Central Tendencies: Mean, Median and Mode
- Measures of Variability: Range, Interquartile range, Variance and Standard Deviation.
- Frequency table -This shows how frequently various values occur.
- Charts -A visual representation of the distribution of values.
Module 5: DATA ANALYSIS WITH VISUAL CHARTS
- Line Chart
- Column/Bar Chart
- Waterfall Chart
- Tree Map Chart
- Box Plot
Module 6: BI-VARIATE DATA ANALYSIS
- Scatter Plots
- Regression Analysis
- Correlation Coefficients
Module 1: PYTHON BASICS
- Introduction to Python
- Installation of Python and IDE
- Python Variables
- Python basic data types
- Number & Booleans, Strings
- Arithmetic Operators
- Comparison Operators
- Assignment Operators
Module 2: PYTHON CONTROL STATEMENTS
- IF Conditional statement
- IF-ELSE
- NESTED IF
- Python Loops basics
- WHILE Statement
- FOR statements
- BREAK and CONTINUE statements
Module 3: PYTHON DATA STRUCTURES
- Basic data structure in python
- Basics of List
- List: Object, methods
- Tuple: Object, methods
- Sets: Object, methods
- Dictionary: Object, methods
Module 4: PYTHON FUNCTIONS
- Functions basics
- Function Parameter passing
- Lambda functions
- Map, reduce, filter functions
Module 1: PYTHON PACKAGES
- Defining packages
- How to create a package
- Importing package
- Installing third-party packages
Module 2: DATA FRAME CREATION USING PANDAS
- Creating dataframes from dictionaries, lists, NumPy arrays, CSV/Excel files, etc.
- Data cleaning
- Filtering
- Grouping
- Aggregation
- Missing values handling
- Descriptive statistics
- Merging & joining datasets
Module 3: VISUALIZATION USING MATPLOTLIB & SEABORN
- Line Plots
- Bar Charts
- Histograms
- Scatter plots
- Heatmaps
- Box plots & customization
Module 4: NUMPY INTRODUCTION
- Arrays
- Indexing
- Slicing
- Reshaping
- Broadcasting
- Mathematical operations
- Performance comparison with lists
Module 1: DATABASE INTRODUCTION
- DATABASE Overview
- Key concepts of database management
- Relational Database Management System
- CRUD operations
Module 2: SQL BASICS
- Introduction to Databases
- Introduction to SQL
- SQL Commands
- MySQL Workbench installation
Module 3: DATA TYPES AND CONSTRAINTS
- Numeric, Character, date, time data type
- Primary key, Foreign key, Not null
- Unique, Check, default, Auto increment
Module 4: DATABASES AND TABLES (MySQL)
- Create a database
- Delete database
- Show and use databases
- Create table, Rename table
- Delete table, Delete table records
- Create a new table from existing data types
- Insert into, Update records
- Alter table
Module 5: SQL JOINS
- Inner Join
- Left Join
- Right Join
- Full Outer Join
- Self Join
- Cross Join
- Multiple Table Joins
- Join with Aggregations
- Handling NULLs in joins
Module 6: SQL COMMANDS AND CLAUSES
- Select, Select distinct
- Aliases, Where clause
- Relational operators, Logical
- Between, Order by, In
- Like, Limit, null/not null, group by
- Having, Sub queries
Module 7: DOCUMENT DB/NO-SQL DB
- Introduction of Document DB
- Document DB vs SQL DB
- Popular Document DBs
- MongoDB basics
- Data format and Key methods
Module 1: OVERVIEW OF STATISTICS
- Introduction to Statistics
- Descriptive And Inferential Statistics
- Basic Terms Of Statistics
- Types Of Data
Module 2: HARNESSING DATA
- Random Sampling
- Sampling With Replacement And Without Replacement
- Cochran's Minimum Sample Size
- Types of Sampling
- Simple Random Sampling
- Stratified Random Sampling
- Cluster Random Sampling
- Systematic Random Sampling
- Multi stage Sampling
- Sampling Error
- Methods Of Collecting Data
Module 3: EXPLORATORY DATA ANALYSIS
- Exploratory Data Analysis Introduction
- Measures Of Central Tendencies: Mean, Median, And Mode
- Measures Of Central Tendencies: Range, Variance And Standard Deviation
- Data Distribution Plot: Histogram
- Normal Distribution & Properties
- Z Value / Standard Value
- Empherical Rule and Outliers
- Central Limit Theorem
- Normality Testing
- Skewness & Kurtosis
- Measures Of Distance: Euclidean, Manhattan, And Minkowski Distance
- Covariance & Correlation
Module 4: HYPOTHESIS TESTING
- Hypothesis Testing Introduction
- P-Value, Critical Region
- Types of Hypothesis Testing
- Hypothesis Testing Errors : Type I And Type II
- Two Sample Independent T-test
- Two Sample Relation T-test
- One Way Anova Test
- Application of Hypothesis testing
Module 1: INTRODUCTION
- MS office Versions (similarities and differences)
- Interface
- Row and columns
- Keyboard shortcuts for easy navigation
- Data Entry (Fill series)
- Find and select
- Clear options
- Formatting options (Font, Alignment, Clipboard)
Module 2: REFERENCING, NAME RANGES, USES, ARITHMETIC FUNCTIONS
- Mathematical calculations with Cell referencing(Absolute, Relative, Mixed)
- Functions with Name Range
Module 3: ARITHMETIC FUNCTIONS
- Arithmetic functions (SUM, SUMIF, SUMIFS, COUNT, COUNTA, COUNTIFS, AVERAGE, AVERAGEIFS, MAX, MAXIFS, MIN, MINIFS)
Module 4: LOGICAL FUNCTIONS
- Logical functions (IF, AND, OR, NESTED IFS, NOT, IFERROR)
Module 5: REFERRING DATA FROM DIFFERENT TABLES
- LOOKUP
- VOOKUP
- NESTED VLOOKUP
- HLOOKUP
- INDEX
- INDEX WITH MATCH FUNCTION
- INDIRECT
- OFFSET
Module 6: DATE AND TEXT FUNCTIONS
- Date Functions (DATE, DAY, MONTH, YEAR, YEARFRAC, DATEDIFF, EOMONTH)
- Text Functions (TEXT, UPPER, LOWER, PROPER, LEFT, RIGHT, SEARCH, FIND, MID, TTC, Flash Fill)
Module 7: DATA HANDLING
- Number Formatting
- Converting Range into a table
- Formatting table
- Remove duplicates
- SORT
- Advanced Sort
- FILTER
- Advanced Filter
Module 8: DATA VISUALIZATION
- Conditional Formatting (icon sets, highlighted colour sets, data bars, custom formatting)
- Charts (Bar, Column, Lines, Scatter, Pie)
Module 9: DATA SUMMARIZATION
- Pivot Reports (Insert, Interface, Crosstable Reports, Filter, Pivot Charts)
- Slicers (Add, connect to multiple reports and charts)
- Calculated field, Calculated item
Module 10: CONNECTING TO DATA: POWER QUERY, PIVOT, POWER PIVOT WITHIN EXCEL
- Power Query: Interface, Tabs
- Connecting to dаta from other Excel files, text files, other sources
- Dаta Cleaning
- Transforming
- Loading Dаta into Excel Query
Module 11: CONNECTING TO DATA: POWER QUERY, PIVOT, POWER PIVOT WITHIN EXCEL
- Using Loaded queries
- Merge and Append
- Insert Power Pivot
- Similarities and Differences in Pivot and Power Pivot reporting
- Getting dаta from databases, workbooks, webpages
Module 12: DATA SUMMARIZATION: DASHBOARD CREATION, TIPS AND TRICKS
- Dashboard: Types, Getting reports and charts together, Use of Slicers.
- Design and placement: Formatting of Tables, Charts, Sheets, Proper use of Colors and Shapes
Module 1: INTRODUCTION TO POWER BI
- What is Power BI? Overview & Importance
- Power BI vs. Excel vs. Other BI Tools
- Power BI Desktop vs. Power BI Service vs. Power BI Mobile
- Installing and Setting Up Power BI
- Understanding the Power BI Interface
- Data Sources Supported in Power BI
Module 2: CONNECTING TO DATA & DATA TRANSFORMATION (POWER QUERY)
- Importing Data from Excel, SQL, Web, APIs, JSON, etc.
- Data Cleaning & Transformation using Power Query
- Handling Missing Data, Duplicates, and Errors
- Splitting & Merging Columns
- Data Type Conversion and Formatting
- Append & Merge Queries
- Unpivoting and Pivoting Data
Module 3: DATA MODELING IN POWER BI
- Introduction to Data Modeling
- Star Schema vs. Snowflake Schema
- Understanding Relationships (One-to-One, One-to-Many, Many-to-Many)
- Creating & Managing Relationships Between Tables
- Data Normalization & Denormalization
- Role of Primary and Foreign Keys
Module 4: DAX (DATA ANALYSIS EXPRESSIONS) - BASICS & ADVANCED
- Introduction to DAX and Why It’s Important
- Basic DAX Functions
- SUM, AVERAGE, COUNT, DISTINCTCOUNT
- Logical DAX Functions
- IF, SWITCH, AND, OR
- Aggregation & Statistical DAX Functions
- SUMX, COUNTX, AVERAGEX, MAXX, MINX
- Time Intelligence DAX Functions
- TOTALYTD, TOTALQTD, TOTALMTD, DATESYTD, PREVIOUSMONTH, SAMEPERIODLASTYEAR
- Working with Calculated Columns & Measures
Module 5: DATA VISUALIZATION IN POWER BI
- Introduction to Power BI Visuals
- Creating Bar, Line, Pie, Donut, and Area Charts
- Scatter Plots and Bubble Charts
- Maps: Basic Map, Filled Map, ArcGIS Map
- KPI Visuals & Cards
- Waterfall & Funnel Charts
- Tree Maps & Matrix Tables
- Customizing Visuals (Colors, Labels, Interactions)
Module 6: ADVANCED VISUALIZATIONS & CUSTOM REPORTS
- Hierarchies & Drill-Through Reports
- Bookmarks & Buttons for Navigation
- Slicers & Filters (Page Level, Report Level, Visual Level)
- Creating Custom Tooltips
- Using Conditional Formatting in Visuals
- Advanced Table & Matrix Visuals
- Custom Visuals from Power BI Marketplace
Module 7: ADVANCED FILTERING & SLICING DATA
- Using Basic & Advanced Filters
- Dynamic Slicers (Sync Slicers Across Pages)
- Cross-Filtering & Highlighting
- Creating Parameterized Reports
- Using Relative Date Filters
Module 8: POWER BI SERVICE & ONLINE PUBLISHING
- Publishing Reports to Power BI Service
- Power BI Workspaces and Sharing Reports
- Scheduling Data Refresh in Power BI Service
- Managing Permissions & Access Control
- Creating Dashboards in Power BI Service
- Power BI Mobile App
Module 9: POWER BI WITH POWER AUTOMATE & POWER APPS
- Introduction to Power Automate
- Automating Data Refresh in Power BI
- Creating Workflows with Power Automate
- Integrating Power BI with Power Apps
Module 1: INTRODUCTION TO TABLEAU
- What is Tableau? Overview & Importance
- Tableau vs. Power BI vs. Excel
- Installing and Setting Up Tableau
- Tableau Products (Tableau Desktop, Tableau Public, Tableau Server, Tableau Online)
- Understanding the Tableau Interface
- Connecting to Different Data Sources
Module 2: CONNECTING TO DATA & DATA PREPARATION
- Importing Data from Excel, SQL, Web, APIs, JSON, etc.
- Data Cleaning in Tableau
- Handling Missing Data, Duplicates, and Errors
- Splitting & Merging Columns
- Pivoting and Unpivoting Data
- Joining & Blending Data
- Creating Data Extracts vs. Live Connections
Module 3: DATA MODELING & RELATIONSHIPS IN TABLEAU
- Understanding Measures & Dimensions
- Working with Relationships, Joins, and Unions
- Data Normalization & Denormalization
- Primary and Foreign Keys in Tableau
- Understanding Data Granularity
Module 4: BASIC & ADVANCED CALCULATIONS IN TABLEAU
- Creating Calculated Fields
- Working with Table Calculations
- String, Date, and Arithmetic Calculations
- Logical Calculations (IF, CASE, AND, OR, NOT)
- Aggregation Calculations (SUM, COUNT, AVG, MIN, MAX)
- Running Total, Moving Average, and Percentile Calculations
Module 5: DATA VISUALIZATION & CHARTS IN TABLEAU
- Basic Charts (Bar, Line, Pie, Scatter, Bubble)
- Dual-Axis Charts & Combined Axis Charts
- Histograms & Box Plots
- Heatmaps & Highlight Tables
- Tree Maps & Packed Bubbles
- Bullet Charts & Lollipop Charts
- Waterfall & Funnel Charts
- Customizing Colors, Labels, and Formatting
Module 6: ADVANCED VISUALIZATION TECHNIQUES
- Creating Hierarchies & Drill-Downs
- Using Filters & Context Filters
- Creating Dynamic Filters
- Parameter Controls for Interactive Dashboards
- Using Sets & Groups for Data Analysis
- Reference Lines, Bands & Distributions
Module 7: MAPS & GEOSPATIAL ANALYTICS IN TABLEAU
- Creating Geographic Maps
- Customizing Map Views
- Using Latitude & Longitude in Maps
- Heat Maps & Density Maps
- Connecting Tableau with Google Maps
- Custom Shapes & Background Images in Maps
Module 8: TABLEAU DASHBOARDS & STORYTELLING
- Building Interactive Dashboards
- Designing Dashboard Layouts
- Dashboard Actions (Filter, Highlight, URL)
- Best Practices for Dashboard Design
- Storytelling with Tableau (Creating Story Points)
- Mobile-Friendly Dashboards
Module 9: ADVANCED DATA ANALYSIS & FORECASTING
- Trend Lines & Forecasting in Tableau
- Clustering & Data Segmentation
- Statistical Analysis (Mean, Median, Standard Deviation)
- Box Plots for Distribution Analysis
- Scenario Analysis & What-If Analysis
- Market Basket Analysis using Tableau
Module 10: TABLEAU SERVER & ONLINE COLLABORATION
- Publishing Workbooks to Tableau Server
- Managing User Roles & Permissions
- Creating and Managing Data Extracts
- Scheduling Data Refresh
- Using Tableau Public & Tableau Online
- Embedding Tableau Visualizations in Websites
Module 1: GIT INTRODUCTION
- Purpose of Version Control
- Popular Version Control Tools
- Git Distribution Version Control
- Terminologies
- Git Workflow
- Git Architecture
Module 2: GIT REPOSITORY and GitHub
- Git Repo Introduction
- Create a New Repo with the Init command
- Git Essentials: Copy & User Setup
- Mastering Git and GitHub
Module 3: COMMITS, PULL, FETCH, AND PUSH
- Git Repo Introduction
- Create a New Repo with the Init command
- Git Essentials: Copy & User Setup
- Mastering Git and GitHub
Module 4: TAGGING, BRANCHING, AND MERGING
- Organize code with branches
- Check out the branch
- Merge branches
Module 5: UNDOING CHANGES
- Editing Commits
- Commit command, Amend flag
- Git reset and revert
Module 6: GIT WITH GITHUB AND BITBUCKET
- Creating a GitHub Account
- Local and Remote Repo
- Collaborating with other developers
- Bitbucket Git account
Module 1: Foundations of AI and ChatGPT
- Introduction to Artificial Intelligence
- Understanding Generative AI and Large Language Models
- ChatGPT compared with traditional chatbots and virtual assistants
- Real-world adoption of ChatGPT across industries
Module 2: Core Concepts in AI
- What is AI? Narrow AI vs. General AI
- Machine Learning basics and applications
- Neural Networks and Deep Learning explained
- Natural Language Processing (NLP) and its role in ChatGPT
- Other AI fields: Computer Vision, Robotics, and Reinforcement Learning
Module 3: Inside ChatGPT
- How ChatGPT generates responses
- Strengths and weaknesses of ChatGPT
- Emerging features and future possibilities
- Ethical concerns and responsible AI usage
Module 4: Practical Applications of ChatGPT
- Writing assistance: Emails, reports, and business communication
- Content creation: Blogs, social media, marketing copy
- Job readiness: Resume, portfolio, and cover letter writing
- Learning companion: Research, tutoring, and knowledge gathering
- Creative uses: Brainstorming, storytelling, and idea generation
Module 5: Prompt Engineering Essentials
- What is Prompt Engineering?
- Types of prompts: Instructional, creative, analytical, role-based
- Best practices for crafting powerful prompts
- Iterative prompting for better results
- How to make ChatGPT generate prompts for you
Have Any Questions? Let's talk!
Please fill out the form below to get assistance from our expert team.
Industry Projects
AI-Powered Disease Prediction System
- Healthcare
This project aims to predict diseases like diabetes, heart disease, and cancer using patient records, lab results, and lifestyle data. It involves structured healthcare datasets, feature engineering, ML/DL models, and possibly NLP for EHRs, with focus on accuracy, interpretability, and data privacy.
Fraud Detection using AI
- Banking & Finance
This project focuses on real-time fraud detection by analyzing transaction history, spending behavior, and anomalies. It uses large financial datasets, ML/DL models, anomaly detection, and may apply reinforcement learning for adaptive fraud prevention.
Personalized Recommendation Engine
- Retail & E-commerce
This project develops an AI-based recommendation system using purchase history, browsing behavior, and demographics. It applies collaborative, content-based, and hybrid filtering with deep learning for personalization, along with big data processing and e-commerce integration.
Predictive Maintenance using AI & IoT
- Manufacturing
This project predicts machine failures using IoT sensor data (vibration, temperature, usage logs) with time-series analysis, anomaly detection, and deep learning. It integrates IoT, cloud, and AI to reduce downtime, optimize maintenance, and cut costs.
AI-Powered Student Performance Analytics
- Education
This project predicts student performance and recommends personalized learning paths using academic data, attendance, and engagement metrics. It applies ML, clustering, and NLP to analyze data, enabling adaptive content and improved teaching outcomes.
Traffic Prediction & Route Optimization
- Transportation & Smart Cities
This project builds an AI system to predict traffic congestion and suggest optimal routes using GPS, camera, and historical road data. It applies ML/DL models for traffic flow and integrates with mapping APIs and reinforcement learning for dynamic route optimization.
Learning Process
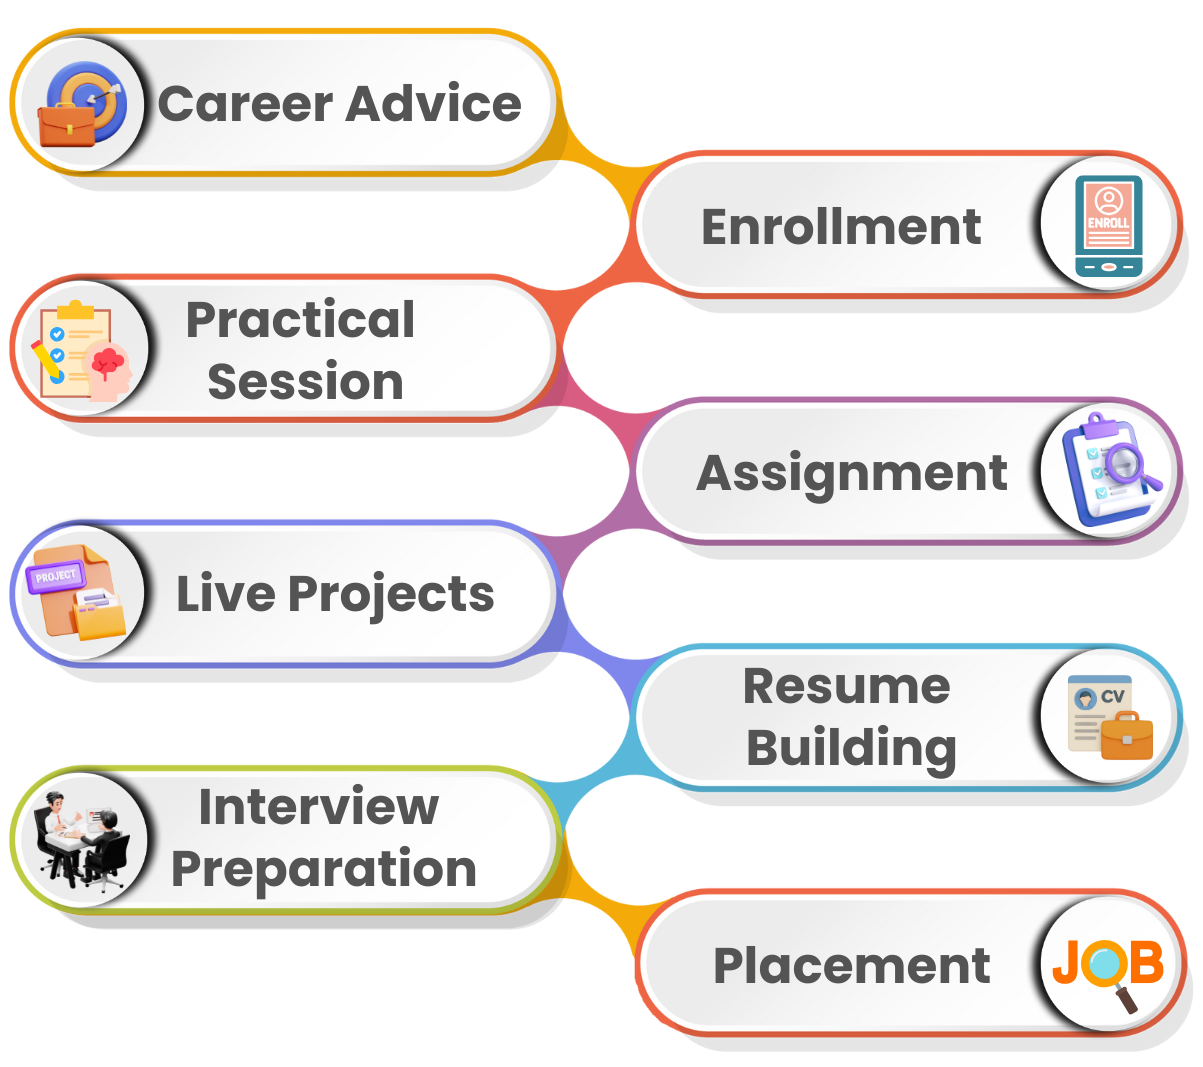
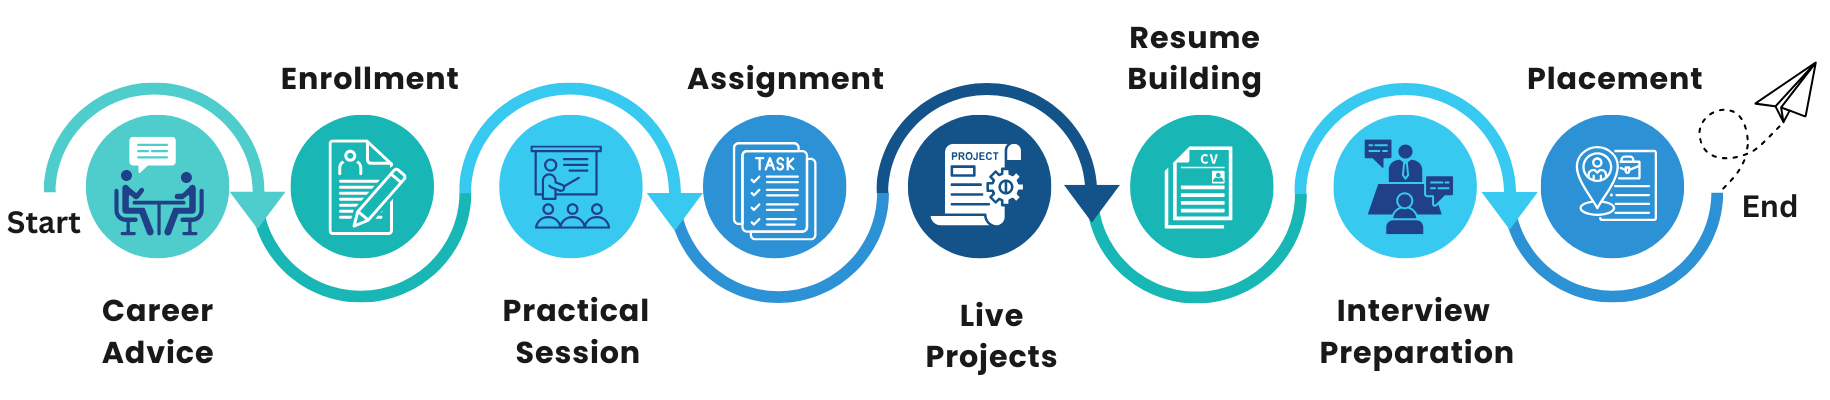
95% of our students successfully get placed after completing our programs.
Learn more about how we’ve been impacting thousands of careers.
Career Assistance Program

Softskill
Session

Resume
Building

Aptitude
Training

LinkedIn Profile Building

Mock
interview

Job
Assistance
Will I Get Certified?
Master Data Analytics with AI and kickstart your journey to becoming a Data Analyst! With our course, you’ll earn a Certification plus module certificates as you progress, while also getting expert guidance. Inquire now to know more!
Earn Your Certificate
Share your Achievement
What Can I Become
Data Analyst
Business Analyst
Marketing Analyst
BI Analyst
Tableau Developer
Statistical Analyst
Visualization Specialist
Insights Analyst
Industries hiring data analysts:
- BFSI
- Retail
- Healthcare
- E-commerce
- Education
- Advertising & Marketing
Have any questions about our Data analytics with AI Program?
EMI Starts at
₹5,000
We partnered with financing companies to provide very competitive
finance options at 0% interest rate
Financing Partners


Our Learners Work At
Get certified proof of your industry experience to showcase your skills to recruiters!
Get certified proof of your industry experience to showcase your skills to recruiters!
It’s proof of your real-world industry exposure and practical skills. With this recognition, you can boost your resume, gain recruiters’ trust, and increase your chances of landing your dream job.
We Develop The Leaders Of Tomorrow
We are proud to have positively influenced the career foundations for thousands of learners across India and Asian countries

Aakansha Chavan
I have enrolled in Full Stack Development course in Ntech Global Solutions. I highly recommend that it is much better than any another institute Best Institute to learn Full Stack Development Course in Andheri. Thanks to all the Staffs and Faculties who were very Supportive throughout the course and help for Mock Session.
⭐⭐⭐⭐⭐

Ankita Bagwe
I recently enrolled in a Data Analyst course at Ntech Global Solutions institute, and I must say it was an excellent experience. The professors here have excellent and deep knowledge about the subject, especially in areas like statistical analysis and data visualization. The trainers here took genuine interest in teaching and ensuring the students understand the concepts, going the extra mile to explain complex modeling techniques and SQL queries. It was a good experience in learning the Data Analyst course.
⭐⭐⭐⭐⭐

Esha Jadhav
I completed my Java Full Stack course from Ntech. I would like to mention that it has been an incredible experience over here. Being from a non IT background I thought it would be difficult for me to cope up with the curriculum but with the help of trainers I am able to understand programming and efficiently implementing it. Great experience!
⭐⭐⭐⭐⭐

Gaurav Vetal
Ntech Global Solutions is good place to learn about Digital marketing. I choose this course to deept my knowledge and understanding as this subject has Specific skills which are required for my career path. The instructors were incredible. Overall experience is nice and actually enjoyed learning.
⭐⭐⭐⭐⭐

Sayali Kale
I had a great learning experience at NGS through their Data Scientist course. The trainers are highly skilled and supportive. The course started from basics, covering Python fundamentals and statistical concepts, and moved to advanced topics like predictive modeling, deep learning architectures, and model deployment (MLOps). We used tools such as Jupyter Notebooks, Scikit-learn, TensorFlow/PyTorch, and deployment platforms like AWS SageMaker and Google Cloud AI Platform. What I loved most was the capstone project experience involving a real-world dataset.
⭐⭐⭐⭐⭐

Ravindra Prajapati
I recently completed the Software Tester course at Ntech Global Solutions and had a fantastic experience. The trainer was highly experienced and made even complex topics easy to understand with real-time examples. I learned Test Case Design, Test Automation (Selenium), and Agile Methodology. We used essential tools like Jira and Postman. The practical focus, including a final automation framework project, built my confidence. Highly recommended for starting a career in QA!
⭐⭐⭐⭐⭐

Akshay Bhardwaj
I had enrolled in a data science course at Ntech Global Solutions, and I'd say it was an amazing experience. Being from a non-IT background, I had zero coding knowledge. But the instructors at Ntech Global Solutions helped me learn everything from scratch. They would always be ready to answer any queries I had during and after the course as well. I would highly recommend this institute to people looking to pursue a course in data science.
⭐⭐⭐⭐⭐
Data Analytics with AI Course in Andheri – Complete Guide to Skills, Jobs & Salary
Introduction
The demand for skilled Data Analysts and AI-driven analytics professionals is rapidly growing across all industries. Companies today generate massive amounts of data through apps, websites, CRM systems, IoT, and business operations. To make better decisions, they need experts who can analyze, visualize, and predict insights using advanced tools and AI technologies.
The Data Analytics with AI Course in Andheri by Ntech Global Solutions is one of the most job-relevant programs designed for students, graduates, and working professionals aspiring to build a strong career in data and analytics. This training covers everything from data cleaning to predictive modeling, along with integrations of modern AI tools that help automate insights.
In this complete guide, you will understand everything about the course, syllabus, skills you gain, tools you learn, job opportunities, salaries, and why you should choose Mumbai to build your career in Data Analytics.
1. What is Data Analytics with AI?
Data Analytics refers to the process of collecting, cleaning, transforming, and analyzing data to extract meaningful insights. AI (Artificial Intelligence) enhances analytics by automating repetitive tasks, making predictions, spotting trends, and generating insights much faster than traditional methods.
When you combine Analytics + AI, you get:
- Faster decision-making
- Better business performance
- Smart predictions
- Automated insights
AI empowers analytics professionals to analyze large volumes of data with high accuracy.
2. Why Learn Data Analytics with AI in 2025?
Here’s why this is the perfect career choice in 2025:
- Massive global demand — LinkedIn ranks Data Analytics as one of the top 5 most in-demand skills.
- High-paying jobs — Freshers earn ₹3–6 LPA, while experienced professionals earn ₹8–20 LPA.
- Applicable across Finance, IT, Retail, Healthcare, Marketing, Logistics, E‑commerce.
- AI will automate low-skill work but create new data-driven roles, and this course prepares you for those future-ready job roles.
3. Why Choose Andheri for Data Analytics Training?
Andheri is India’s financial, startup, and technology capital. Learning the Data Analytics with AI Course in Andheri gives you access to:
More than 5000+ job openings every month — Companies like TCS, Accenture, Infosys, Deloitte, Capgemini, Morgan Stanley hire data professionals in Mumbai.
Industry-relevant training — Mumbai-based training institutes offer real-life business data projects.
Better internship & placement opportunities — From corporates to startups the ecosystem supports skilled data professionals.
4. Skills You Will Learn in This Course
This training helps you master both analytical and AI-driven skills:
5. Salary After Data Analytics with AI Training in Mumbai
Salary ranges in Mumbai:
| Experience | Salary Range (Mumbai) |
|---|---|
| Freshers | ₹3 LPA – ₹6 LPA |
| 1–2 Years | ₹5 LPA – ₹8 LPA |
| 3+ Years | ₹8 LPA – ₹20 LPA |
6. Who Can Join This Course?
Graduates (BSc, BCom, BCA, BE, BBA), MBA students, working professionals, non-IT employees, job seekers and entrepreneurs. No prior coding experience required.
7. Why Choose Ntech Global Solutions?
This course is suitable for:
- Industry-expert trainers
- Real-time datasets
- Practical training
- Live projects
- Placement assistance
- Affordable fees
- Certification included
8. Final Conclusion
If you want to build a career in a high-demand domain, the Data Analytics with AI Course in Mumbai is one of the best choices. With hands-on practical training, AI tools, and job support, you can start a rewarding career with excellent growth opportunities.
Become a Data Analytics Specialist
FAQs for Data Analytics with AI Course in Andheri
Data Analytics with Artificial Intelligence combines traditional data analysis techniques with AI and machine learning to extract insights, automate decision-making, and predict future trends using real-world data.
This course is ideal for students, graduates, IT professionals, non-IT professionals, and anyone looking to transition into a data analytics or AI-driven career. No prior coding experience is mandatory.
You will learn Python, SQL, Power BI, Excel, Machine Learning algorithms, AI concepts, data visualization tools, and real-time analytics techniques.
Yes. Ntech Global Solutions offers 100% placement assistance, including resume building, interview preparation, mock interviews, and job referrals.
The course duration typically ranges from 3 to 6 months, depending on the learning mode and batch schedule.
Yes. You will receive an industry-recognized Data Analytics with AI certification from Ntech Global Solutions upon successful completion.
Take Action: Get Expert Guidance Now!
Ready for personalized advice? Take the first step! Fill out our form today to connect with our team of experts and get the solutions you need.

We’ll get back to you shortly
Start Your Career in
Tech Industry
Today!
Limited Time Offer!
GET 10% OFF
On All Courses
At Ntech Global Solutions, India's best training institute founded by IITians, we help people learn essential software skills. Join us to connect academia with industry.
Quick Links
Our Courses
Newsletter
Andheri (East) Branch
Address
4th Floor, Vertex Vikas Building, 401-A, Court Ln, opposite Railway Station, near Metro Station, Andheri East, Mumbai, Maharashtra 400069Phone: +91 9322015102
Other Branches
Andheri (West)
Thane (West)
Vapi
Full Stack Developer Course | Full Stack Java Developer Course | Full Stack Python Developer Course | MEAN Stack Developer Course | MERN Stack Developer Course
Digital Marketing & Ecommerce Development | Digital Marketing with Artificial Intelligence | Short Term Digital Marketing Program | Search Engine Optimization Program
AWS Solution Architect | Azure Certification Course | Cyber Security Course | Ethical Hacking Course
Software Testing | Automation Testing | Selenium Automation Testing | Performance Testing
© 2026 Ntech Global Solutions, Inc. All rights reserved.