Data Analytics With AWS

⭐⭐⭐⭐⭐
Master Data Analytics with AWS and Become Job-Ready
Our Data Analytics with AWS course at Ntech Global Solutions equips you with the skills to collect, process, and analyze large datasets using Amazon Web Services. Learn AWS tools like Redshift, QuickSight, Glue, and S3 to build scalable analytics solutions. Perfect for beginners and professionals aiming to excel in cloud-based data analytics.
Student's Trained
0Hiring Partners
0Placement Record
0/span>Highest Salary Drawn
0Our Learners Work At


About This Program
Join our Data Analytics with AWS Course to master cloud-based analytics using AWS tools like Redshift, QuickSight, Glue, and S3. Gain hands-on experience in collecting, processing, and visualizing data to make data-driven decisions. Enroll now to launch your career in cloud-powered data analytics!
Data Analytics With AWS Curriculum
Module 1: DATA ANALYSIS FOUNDATION
- Data Analysis Introduction
- Data Preparation for Analysis
- Common Data Problems
- Various Tools for Data Analysis
- Evolution of the Analytics domain
Module 2: CLASSIFICATION OF ANALYTICS
- Four types of the Analytics
- Descriptive Analytics
- Diagnostics Analytics
- Predictive Analytics
- Prescriptive Analytics
- Human Input in Various type of Analytics
Module 3: CRIP-DM Model
- Introduction to CRIP-DM Model
- Business Understanding
- Data Understanding
- Data Preparation
- Modeling, Evaluation, Deploying, Monitoring
Module 4: UNIVARIATE DATA ANALYSIS
- Summary statistics -Determines the value’s center and spread.
- Measure of Central Tendencies: Mean, Median and Mode
- Measures of Variability: Range, Interquartile range, Variance and Standard Deviation.
- Frequency table -This shows how frequently various values occur.
- Charts -A visual representation of the distribution of values.
Module 5: DATA ANALYSIS WITH VISUAL CHARTS
- Line Chart
- Column/Bar Chart
- Waterfall Chart
- Tree Map Chart
- Box Plot
Module 6: BI-VARIATE DATA ANALYSIS
- Scatter Plots
- Regression Analysis
- Correlation Coefficients
Module 1: PYTHON BASICS
- Introduction to Python
- Installation of Python and IDE
- Python Variables
- Python basic data types
- Number & Booleans, Strings
- Arithmetic Operators
- Comparison Operators
- Assignment Operators
Module 2: PYTHON CONTROL STATEMENTS
- IF Conditional statement
- IF-ELSE
- NESTED IF
- Python Loops basics
- WHILE Statement
- FOR statements
- BREAK and CONTINUE statements
Module 3: PYTHON DATA STRUCTURES
- Basic data structure in python
- Basics of List
- List: Object, methods
- Tuple: Object, methods
- Sets: Object, methods
- Dictionary: Object, methods
Module 4: PYTHON FUNCTIONS
- Functions basics
- Function Parameter passing
- Lambda functions
- Map, reduce, filter functions
Module 1: PYTHON PACKAGES
- Defining packages
- How to create a package
- Importing package
- Installing third-party packages
Module 2: DATA FRAME CREATION USING PANDAS
- Creating dataframes from dictionaries, lists, NumPy arrays, CSV/Excel files, etc.
- Data cleaning
- Filtering
- Grouping
- Aggregation
- Missing values handling
- Descriptive statistics
- Merging & joining datasets
Module 3: VISUALIZATION USING MATPLOTLIB & SEABORN
- Line Plots
- Bar Charts
- Histograms
- Scatter plots
- Heatmaps
- Box plots & customization
Module 4: NUMPY INTRODUCTION
- Arrays
- Indexing
- Slicing
- Reshaping
- Broadcasting
- Mathematical operations
- Performance comparison with lists
Module 1: DATABASE INTRODUCTION
- DATABASE Overview
- Key concepts of database management
- Relational Database Management System
- CRUD operations
Module 2: SQL BASICS
- Introduction to Databases
- Introduction to SQL
- SQL Commands
- MySQL Workbench installation
Module 3: DATA TYPES AND CONSTRAINTS
- Numeric, Character, date, time data type
- Primary key, Foreign key, Not null
- Unique, Check, default, Auto increment
Module 4: DATABASES AND TABLES (MySQL)
- Create a database
- Delete database
- Show and use databases
- Create table, Rename table
- Delete table, Delete table records
- Create a new table from existing data types
- Insert into, Update records
- Alter table
Module 5: SQL JOINS
- Create a database
- Delete database
- Show and use databases
- Create table, Rename table
- Delete table, Delete table records
- Create a new table from existing data types
- Insert into, Update records
- Alter table
Module 6: SQL COMMANDS AND CLAUSES
- Select, Select distinct
- Aliases, Where clause
- Relational operators, Logical
- Between, Order by, In
- Like, Limit, null/not null, group by
- Having, Sub queries
Module 7: DOCUMENT DB/NO-SQL DB
- Introduction of Document DB
- Document DB vs SQL DB
- Popular Document DBs
- MongoDB basics
- Data format and Key methods
Module 1: OVERVIEW OF STATISTICS
- Introduction to Statistics
- Descriptive And Inferential Statistics
- Basic Terms Of Statistics
- Types Of Data
Module 2: HARNESSING DATA
- Random Sampling
- Sampling With Replacement And Without Replacement
- Cochran's Minimum Sample Size
- Types of Sampling
- Simple Random Sampling
- Stratified Random Sampling
- Cluster Random Sampling
- Systematic Random Sampling
- Multi stage Sampling
- Sampling Error
- Methods Of Collecting Data
Module 3: EXPLORATORY DATA ANALYSIS
- Exploratory Data Analysis Introduction
- Measures Of Central Tendencies: Mean, Median, And Mode
- Measures Of Central Tendencies: Range, Variance And Standard Deviation
- Data Distribution Plot: Histogram
- Normal Distribution & Properties
- Z Value / Standard Value
- Empherical Rule and Outliers
- Central Limit Theorem
- Normality Testing
- Skewness & Kurtosis
- Measures Of Distance: Euclidean, Manhattan, And Minkowski Distance
- Covariance & Correlation
Module 4: HYPOTHESIS TESTING
- Hypothesis Testing Introduction
- P- Value, Critical Region
- Types of Hypothesis Testing
- Hypothesis Testing Errors : Type I And Type II
- Two Sample Independent T-test
- Two Sample Relation T-test
- One Way Anova Test
- Application of Hypothesis testing
Module 1: INTRODUCTION
- MS office Versions (similarities and differences)
- Interface
- Row and columns
- Keyboard shortcuts for easy navigation
- Data Entry (Fill series)
- Find and select
- Clear options
- Formatting options (Font, Alignment, Clipboard)
Module 2: REFERENCING, NAME RANGES, USES, ARITHMETIC FUNCTIONS
- Mathematical calculations with Cell referencing(Absolute, Relative, Mixed)
- Functions with Name Range
Module 3: ARITHMETIC FUNCTIONS
- Arithmetic functions (SUM, SUMIF, SUMIFS, COUNT, COUNTA, COUNTIFS, AVERAGE, AVERAGEIFS, MAX, MAXIFS, MIN, MINIFS)
Module 4: LOGICAL FUNCTIONS
- Logical functions (IF, AND, OR, NESTED IFS, NOT, IFERROR)
Module 5: REFERRING DATA FROM DIFFERENT TABLES
- LOOKUP
- VOOKUP
- NESTED VLOOKUP
- HLOOKUP
- INDEX
- INDEX WITH MATCH FUNCTION
- INDIRECT
- OFFSET
Module 6: DATE AND TEXT FUNCTIONS
- Date Functions (DATE, DAY, MONTH, YEAR, YEARFRAC, DATEDIFF, EOMONTH)
- Text Functions (TEXT, UPPER, LOWER, PROPER, LEFT, RIGHT, SEARCH, FIND, MID, TTC, Flash Fill)
Module 7: DATA HANDLING
- Number Formatting
- Converting Range into a table
- Formatting table
- Remove duplicates
- SORT
- Advanced Sort
- FILTER
- Advanced Filter
Module 8: DATA VISUALIZATION
- Conditional Formatting (icon sets, highlighted colour sets, data bars, custom formatting)
- Charts (Bar, Column, Lines, Scatter, Pie)
Module 9: DATA SUMMARIZATION
- Pivot Reports (Insert, Interface, Crosstable Reports, Filter, Pivot Charts)
- Slicers (Add, connect to multiple reports and charts)
- Calculated field, Calculated item
Module 10: CONNECTING TO DATA: POWER QUERY, PIVOT, POWER PIVOT WITHIN EXCEL
- Power Query: Interface, Tabs
- Connecting to dаta from other Excel files, text files, other sources
- Dаta Cleaning
- Transforming
- Loading Dаta into Excel Query
Module 11: CONNECTING TO DATA: POWER QUERY, PIVOT, POWER PIVOT WITHIN EXCEL
- Using Loaded queries
- Merge and Append
- Insert Power Pivot
- Similarities and Differences in Pivot and Power Pivot reporting
- Getting dаta from databases, workbooks, webpages
Module 12: DATA SUMMARIZATION: DASHBOARD CREATION, TIPS AND TRICKS
- Dashboard: Types, Getting reports and charts together, Use of Slicers.
- Design and placement: Formatting of Tables, Charts, Sheets, Proper use of Colors and Shapes
Module 1: INTRODUCTION TO POWER BI
- What is Power BI? Overview & Importance
- Power BI vs. Excel vs. Other BI Tools
- Power BI Desktop vs. Power BI Service vs. Power BI Mobile
- Installing and Setting Up Power BI
- Understanding the Power BI Interface
- Data Sources Supported in Power BI
Module 2: CONNECTING TO DATA & DATA TRANSFORMATION (POWER QUERY)
- Importing Data from Excel, SQL, Web, APIs, JSON, etc.
- Data Cleaning & Transformation using Power Query
- Handling Missing Data, Duplicates, and Errors
- Splitting & Merging Columns
- Data Type Conversion and Formatting
- Append & Merge Queries
- Unpivoting and Pivoting Data
Module 3: DATA MODELING IN POWER BI
- Introduction to Data Modeling
- Star Schema vs. Snowflake Schema
- Understanding Relationships (One-to-One, One-to-Many, Many-to-Many)
- Creating & Managing Relationships Between Tables
- Data Normalization & Denormalization
- Role of Primary and Foreign Keys
Module 4: DAX (DATA ANALYSIS EXPRESSIONS) - BASICS & ADVANCED
- Introduction to DAX and Why It’s Important
- Basic DAX Functions
- SUM, AVERAGE, COUNT, DISTINCTCOUNT
- Logical DAX Functions
- IF, SWITCH, AND, OR
- Aggregation & Statistical DAX Functions
- SUMX, COUNTX, AVERAGEX, MAXX, MINX
- Time Intelligence DAX Functions
- TOTALYTD, TOTALQTD, TOTALMTD, DATESYTD, PREVIOUSMONTH, SAMEPERIODLASTYEAR
- Working with Calculated Columns & Measures
Module 5: DATA VISUALIZATION IN POWER BI
- Introduction to Power BI Visuals
- Creating Bar, Line, Pie, Donut, and Area Charts
- Scatter Plots and Bubble Charts
- Maps: Basic Map, Filled Map, ArcGIS Map
- KPI Visuals & Cards
- Waterfall & Funnel Charts
- Tree Maps & Matrix Tables
- Customizing Visuals (Colors, Labels, Interactions)
Module 6: ADVANCED VISUALIZATIONS & CUSTOM REPORTS
- Hierarchies & Drill-Through Reports
- Bookmarks & Buttons for Navigation
- Slicers & Filters (Page Level, Report Level, Visual Level)
- Creating Custom Tooltips
- Using Conditional Formatting in Visuals
- Advanced Table & Matrix Visuals
- Custom Visuals from Power BI Marketplace
Module 7: ADVANCED FILTERING & SLICING DATA
- Using Basic & Advanced Filters
- Dynamic Slicers (Sync Slicers Across Pages)
- Cross-Filtering & Highlighting
- Creating Parameterized Reports
- Using Relative Date Filters
Module 8: POWER BI SERVICE & ONLINE PUBLISHING
- Publishing Reports to Power BI Service
- Power BI Workspaces and Sharing Reports
- Scheduling Data Refresh in Power BI Service
- Managing Permissions & Access Control
- Creating Dashboards in Power BI Service
- Power BI Mobile App
Module 9: POWER BI WITH POWER AUTOMATE & POWER APPS
- Introduction to Power Automate
- Automating Data Refresh in Power BI
- Creating Workflows with Power Automate
- Integrating Power BI with Power Apps
Module 1: INTRODUCTION TO TABLEAU
- What is Tableau? Overview & Importance
- Tableau vs. Power BI vs. Excel
- Installing and Setting Up Tableau
- Tableau Products (Tableau Desktop, Tableau Public, Tableau Server, Tableau Online)
- Understanding the Tableau Interface
- Connecting to Different Data Sources
Module 2: CONNECTING TO DATA & DATA PREPARATION
- Importing Data from Excel, SQL, Web, APIs, JSON, etc.
- Data Cleaning in Tableau
- Handling Missing Data, Duplicates, and Errors
- Splitting & Merging Columns
- Pivoting and Unpivoting Data
- Joining & Blending Data
- Creating Data Extracts vs. Live Connections
Module 3: DATA MODELING & RELATIONSHIPS IN TABLEAU
- Understanding Measures & Dimensions
- Working with Relationships, Joins, and Unions
- Data Normalization & Denormalization
- Primary and Foreign Keys in Tableau
- Understanding Data Granularity
Module 4: BASIC & ADVANCED CALCULATIONS IN TABLEAU
- Creating Calculated Fields
- Working with Table Calculations
- String, Date, and Arithmetic Calculations
- Logical Calculations (IF, CASE, AND, OR, NOT)
- Aggregation Calculations (SUM, COUNT, AVG, MIN, MAX)
- Running Total, Moving Average, and Percentile Calculations
Module 5: DATA VISUALIZATION & CHARTS IN TABLEAU
- Basic Charts (Bar, Line, Pie, Scatter, Bubble)
- Dual-Axis Charts & Combined Axis Charts
- Histograms & Box Plots
- Heatmaps & Highlight Tables
- Tree Maps & Packed Bubbles
- Bullet Charts & Lollipop Charts
- Waterfall & Funnel Charts
- Customizing Colors, Labels, and Formatting
Module 6: ADVANCED VISUALIZATION TECHNIQUES
- Creating Hierarchies & Drill-Downs
- Using Filters & Context Filters
- Creating Dynamic Filters
- Parameter Controls for Interactive Dashboards
- Using Sets & Groups for Data Analysis
- Reference Lines, Bands & Distributions
Module 7: MAPS & GEOSPATIAL ANALYTICS IN TABLEAU
- Creating Geographic Maps
- Customizing Map Views
- Using Latitude & Longitude in Maps
- Heat Maps & Density Maps
- Connecting Tableau with Google Maps
- Custom Shapes & Background Images in Maps
Module 8: TABLEAU DASHBOARDS & STORYTELLING
- Building Interactive Dashboards
- Designing Dashboard Layouts
- Dashboard Actions (Filter, Highlight, URL)
- Best Practices for Dashboard Design
- Storytelling with Tableau (Creating Story Points)
- Mobile-Friendly Dashboards
Module 9: ADVANCED DATA ANALYSIS & FORECASTING
- Trend Lines & Forecasting in Tableau
- Clustering & Data Segmentation
- Statistical Analysis (Mean, Median, Standard Deviation)
- Box Plots for Distribution Analysis
- Scenario Analysis & What-If Analysis
- Market Basket Analysis using Tableau
Module 10: TABLEAU SERVER & ONLINE COLLABORATION
- Publishing Workbooks to Tableau Server
- Managing User Roles & Permissions
- Creating and Managing Data Extracts
- Scheduling Data Refresh
- Using Tableau Public & Tableau Online
- Embedding Tableau Visualizations in Websites
Module 1: GIT INTRODUCTION
- Purpose of Version Control
- Popular Version Control Tools
- Git Distribution Version Control
- Terminologies
- Git Workflow
- Git Architecture
Module 2: GIT REPOSITORY and GitHub
- Git Repo Introduction
- Create a New Repo with the Init command
- Git Essentials: Copy & User Setup
- Mastering Git and GitHub
Module 3: COMMITS, PULL, FETCH, AND PUSH
- Git Repo Introduction
- Create a New Repo with the Init command
- Git Essentials: Copy & User Setup
- Mastering Git and GitHub
Module 4: TAGGING, BRANCHING, AND MERGING
- Organize code with branches
- Check out the branch
- Merge branches
Module 5: UNDOING CHANGES
- Editing Commits
- Commit command, Amend flag
- Git reset and revert
Module 6: GIT WITH GITHUB AND BITBUCKET
- Creating a GitHub Account
- Local and Remote Repo
- Collaborating with other developers
- Bitbucket Git account
Module 1: INTRODUCTION
- Overview of Cloud
- Overview of Amazon Web Services
- Overview of Services
- Shared Responsibility Model
- Global vs Regional Infrastructure
- Fault Tolerant vs High Availability
- Documentation / Compliance Programs
- AWS Account Creation
Module 2: IDENTITY & ACCESS MANAGEMENT (IAM)
- Introduction to IAM
- Account Settings
- IAM Users / Groups / Policies / Roles
- Creating a Billing Alarm
- Root Account Details
Module 3: SIMPLE STORAGE SERVICE (S3)
- Introduction
- Storage Classes
- Pricing
- Creating an S3 bucket
- S3 permissions using ACLs, IAM & Bucket Policies
- Versioning in S3
- Cross Region Replication
- Lifecycle Management Rules
- Encryption
- Static Website Hosting
Module 4: NETWORKING
- Introduction
- Virtual Private Cloud (VPC)
- Pricing
- Subnetting
- Network Routing
- NAT vs Bastions
- VPC Endpoints
- VPC Flow Logs
- Security Groups & Network ACLs
- VPC Peering
- AWS Direct Connec
Module 5: ELASTIC COMPUTE CLOUD (EC2) – I
- Introduction
- Pricing model (OnDemand/SPOT/RI)
- SSH Keys
- Putty Setup
- EC2 Instance Types
- EC2 Userdata & Metadata
- Public, Private & Elastic IP addresses
- Storage Options: Instance Store vs Elastic Block Store (EBS)
- CloudWatch
- Security in EC2
- EBS Snapshot
- Amazon Machine Image (AMI)
- EC2 Placement Groups
Module 6: ELASTIC COMPUTE CLOUD (EC2) – II
- Elastic Load Balancing (ELB)
- Autoscaling
Module 7: DATABASE SERVICES
- Introduction
- Type of Relational Database Services (RDS)
- Amazon Redshift
- Amazon Dynamo DB
- Pricing
- Aurora
- High Availability & Disaster Recovery
- Elastic Cache
Module 8: INDIVIDUAL SERVICES
- Cloudwatch
- Elastic File System (EFS)
- FSx Windows
- FSx Lusture
Module 9: ROUTE53
- Simple Routing Policy
- SimpleWeighted Routing Policy
- SimpleFailover Routing Policy
- SimpleGeolocation Routing Policy
- SimpleLatency Routing Policy
- SimpleMultivalue Answer Routing Policy
Module 10: MANAGED APPLICATION SERVICES
- Simple Queue Service (SQS)
- Simple Email Service (SES)
- Simple Notification Service (SNS)
- Storage Gateway essentials
- CloudFront essentials
- Cloudtrail
- Cloudformation
- AWS Lambda
- Consolidated Billing
- Systems Manager
- ECS & EKS
Module 11: ANALYTICS APPLICATION
- API Gateway essentials
- Kinesis essentials
- Elastic MapReduce (EMR)
- Amazon Athena
- Amazon Quicksignt
Have Any Questions? Let's talk!
Please fill out the form below to get assistance from our expert team.
What You’ll Master
Kickstart your Data Analytics journey with our all-in-one course! Learn Excel, SQL, Power BI, Tableau, AWS, Data Visualization, and more—using industry-standard tools and real-world datasets.









Have any questions about our Data Analytics with AI Program?
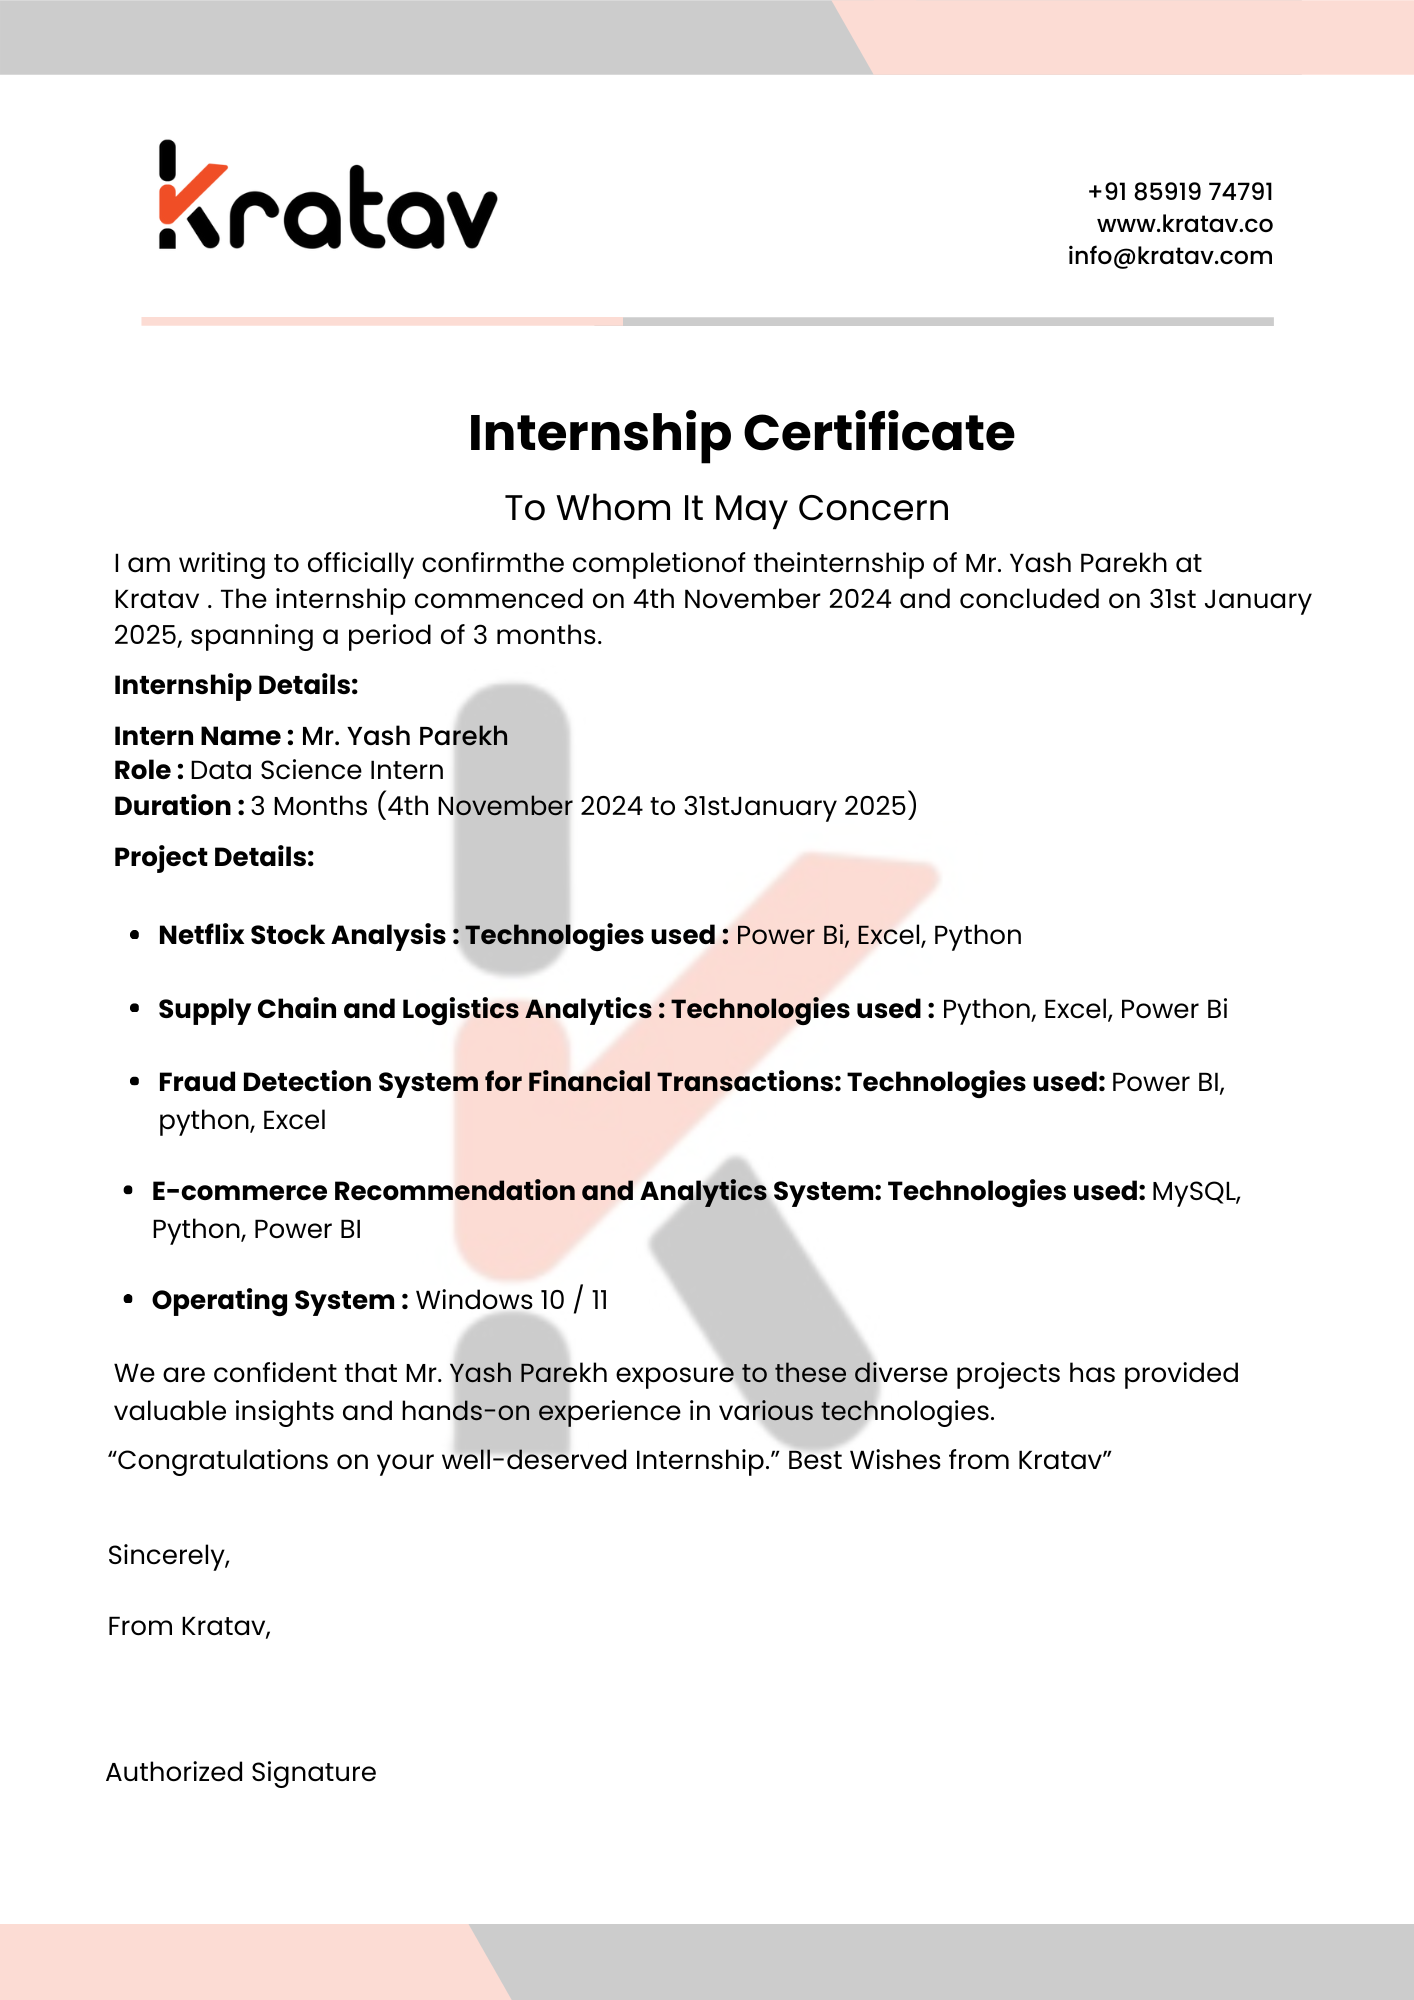
Will I Get Certified?
When you finish our Data Analytics with AI Course, you'll get a certificate. It'll help your career and set you up for success in the tech industry by providing significant value.
Earn Your Certificate
Share your Achievement

Why Ntech Global Solutions
Being in the industry for over ten years, we always bring you the latest happenings, so your training is best-in-quality and more engaging

Live Project Training
Unlimited Classes for 365 days

Interest-Free / No-Cost EMI
All Debit/Credit Cards / Netbanking / UPI

4.8/5 Stars on Google Reviews
Real Students google Reviews

85% Placement Record
We have an dedicated Placement Team
We Develop The Leaders Of Tomorrow
We are proud to have positively influenced the career foundations for thousands of learners across India and Asian countries

Aakansha Chavan
I have enrolled in Full Stack Development course in Ntech Global Solutions. I highly recommend that it is much better than any another institute Best Institute to learn Full Stack Development Course in Andheri. Thanks to all the Staffs and Faculties who were very Supportive throughout the course and help for Mock Session.

⭐⭐⭐⭐⭐

Ankita Bagwe
I recently enrolled in a Full Stack Development course at Ntech Global Solutions institute, and I must say it was an excellent experience. The professors here have excellent and deep knowledge about the subject. The trainers here took genuine interest in teaching and ensuring the students understand the concepts. It was a good experience in learning Full stack Development course.

⭐⭐⭐⭐⭐

Esha Jadhav
Ntech Global Solutions is good place to learn about Digital marketing. I choose this course to deept my knowledge and understanding as this subject has Specific skills which are required for my career path. The instructors were incredible. Overall experience is nice and actually enjoyed learning.

⭐⭐⭐⭐⭐

Gaurav Vetal
I completed my Java Full Stack course from Ntech. I would like to mention that it has been an incredible experience over here. Being from a non IT background I thought it would be difficult for me to cope up with the curriculum but with the help of trainers I am able to understand programming and efficiently implementing it. Great experience!

⭐⭐⭐⭐⭐

Sayali Kale
I had a great learning experience at NGS through their Full Stack Developer course. The trainers are highly skilled and supportive. The course started from basics and moved to advanced topics like API integration, database connectivity, and authentication using JWT. We used tools such as Git, MongoDB Compass, and deployment platforms like Vercel and Netlify. What I loved most was the live project experience which helped me understand real-world development. Totally worth it!

⭐⭐⭐⭐⭐

Ravindra Prajapati
I recently completed the Web Developer course at Ntech Global Solutions and had a fantastic experience. The trainer was highly experienced and made even complex topics easy to understand with real-time examples. Throughout the course, I learned HTML5, CSS3, JavaScript, and Bootstrap, along with basic concepts of responsive design and website optimization. We also used tools like Visual Studio Code, GitHub, Chrome DevTools, and Figma. The course was very practical, with multiple mini-projects and one capstone project that helped me build confidence. The overall experience was smooth, well-organized, and perfect for anyone wanting to start a career in web development. Highly recommended!

⭐⭐⭐⭐⭐

Akshay Bhardwaj
I had enrolled in a data science course at Ntech Global Solutions, and I'd say it was an amazing experience. Being from a non-IT background, I had zero coding knowledge. But the instructors at Ntech Global Solutions helped me learn everything from scratch. They would always be ready to answer any queries I had during and after the course as well. I would highly recommend this institute to people looking to pursue a course in data science.

⭐⭐⭐⭐⭐
Become a Data Analytics Specialist
Frequently Asked Questions Data Analytics with AWS Course
This course teaches you how to collect, process, analyze, and visualize data using Amazon Web Services (AWS) tools.
Beginners, data professionals, and anyone interested in cloud-based analytics can join.
You’ll learn data collection, processing, visualization, cloud storage, and analytics using AWS services.
You’ll work with AWS Redshift, QuickSight, Glue, S3, Athena, and Kinesis.
No, the course starts from basics and gradually moves to advanced AWS analytics concepts.
Yes, you’ll work on real-world projects to apply AWS analytics tools effectively.
You’ll receive a course completion certificate from our institute. AWS certification guidance is also provided.
Yes, the course content aligns with AWS exam topics and helps you prepare.
The duration depends on the batch schedule, typically ranging from 2 to 3 months.
Yes, we offer both online and classroom training options.
Yes, you’ll use AWS QuickSight and other tools for creating dashboards and reports.
Yes, we offer 85% placement support including resume building and interview preparation.
You can apply for roles like Data Analyst, AWS Data Engineer, BI Analyst, and Cloud Data Specialist.
AWS offers scalable, secure, and cost-effective cloud-based analytics solutions for handling large datasets.
You can enroll through our website or contact our admissions team for guidance.
Take Action: Get Expert Guidance Now!
Ready for personalized advice? Take the first step! Fill out our form today to connect with our team of experts and get the solutions you need.


